It’s Time for Private Equity to Join the (4th Industrial) Revolution!
Data is increasingly viewed as the driving force behind what is now known as the 4th Industrial Revolution, a term coined by Klaus Schwab, Founder and Executive Chairman of the World Economic Forum (WEF).
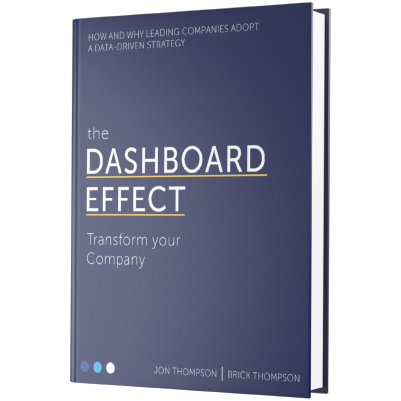
Realizing that mobilizing data is the most accessible strategy for transforming organizations and catalyzing growth, the business world is experiencing a transformational shift towards data transparency. A shift which business leaders, particularly in the private equity sector, should heed. Blue Margin details key insights on how this change may shape your business strategy in our book, The Dashboard Effect, which outlines how companies are using data to move to the forefront of their industries.
As a shift toward greater transparency in business is underway, the private equity sector in particular is driving this trend as they innovate to improve execution and rely less on the arbitrage of multiples. The primary focus is an increase in “digital transformation.” Unfortunately, this trendy phrase is often where the conversation stops, leaving an uncertain path to execution. Why? Because digital transformation is all encompassing, covering everything from systems integration to process automation, from cybersecurity to machine learning.
Do you know where to start?
We recommend you start by providing better data visibility through a dashboard that defines key performance indicators and measures against them with real-time visible feedback. This approach provides the tools for efficient and intuitive workflows, staff who are informed on their performance and the performance of their peers, and effective communications. Every employee knows every day how the company is performing, and how they are contributing to that performance.
Knowledge is Power
Implementing visibility may require a shift, but the rewards are profit and sustainability. Knowledge makes work less of a mystery, and more knowledge makes work more gratifying by empowering employees to succeed by providing a personal, measurable goal and tracking performance. Knowledge creates camaraderie through healthy competition and by clarifying how individual goals work together to advance the team’s goals. It also gives every manager from the top to the bottom of the organization a simple but powerful tool to measurably influence performance. The Dashboard Effect doesn’t mean that influence trickles down from the top, but that the flow of accountability runs both upward and downward through the organization.
In summary, data transparency and visibility is necessary to assess your company’s performance, to expose what’s working and points of constraint, and to allow management teams to align on the company’s value creation plan.
Companies that have successfully implemented dashboards and analytics can:
- Highlight performance metrics for the organization to see
- Create a tangible sense of shared vision between employees
- Provide executives a single source to oversee and manage the business
Use Dashboards to Drive Performance
If you’re still trying to inspire employees through annual performance reviews and complex compensation packages, it may be time to rethink your strategy. According to a number of studies, a rising salary is no longer an indicator of job satisfaction. Likewise, many companies have ditched annual reviews as they’ve proven to be counterproductive.
Which factors have proven to contribute to productivity and overall job satisfaction? Clear performance indicators and job accountability. Dashboards provide both to improve not only team performance but the overall growth of your business.
Let’s use the sports industry as an example.
There are few industries more lucrative and engaging than competitive sports, but have you ever paused to consider why? Why do millions of fans invest their hard-earned money to face the heat, eat overpriced nachos, and squeeze into overcrowded stadiums?
We do it because we want to witness firsthand heroic moments when athletes accomplish impossible feats. We feel inspired as athletes push far beyond limitations to score. Have you thought about what it is that drives these athletes?
The score.
The data contained on the scoreboard gives meaning to the idea of winning and fuels the competition. In other words, you can’t win unless you measure, and data is the key to keeping score.
All Data in a Glance – A Scoreboard Approach
Knowing in a single glance how one team ranks against its opponent and how much time is available to reclaim the lead is what keeps athletes driven and fans invested.
The solution to improving employee performance and satisfaction is the same: provide your team with a scoreboard that displays current performance against your most pressing goals in a single glance.
This sounds simple, yet has proven results time and again across a variety of industries. In business, we drive performance by modeling the drivers of human nature just as great sports teams do. By consolidating company’s data and sharing scoreboards (dashboards) you can create a team of top athletes who all have an ownership mentality and work together to win. Blue Margin Inc. has empowered hundreds of businesses to increase growth and profitability by mobilizing their data.
Consider the following statistics:
- Nearly 8/10 executives agree that harnessing all of their data would lead to a stronger business*
- 67% of North American businesses declared interest in using advanced analytics to improve business operations*
Private equity firms and their portfolio companies can no longer compete in this changing landscape without mobilizing necessary data to equip employees and managers. Blue Margin offers a no-cost consultation to help sponsored companies understand their data-readiness and opportunity to use data as a differentiator for growth and valuation.
If you’d like to see case studies of mid-market companies who have turned their data into high-value assets that drive performance, click here.
-The Blue Margin Team
